


Study asks, Where does Colorado rank in ‘best mountain biking experience’ nationally?
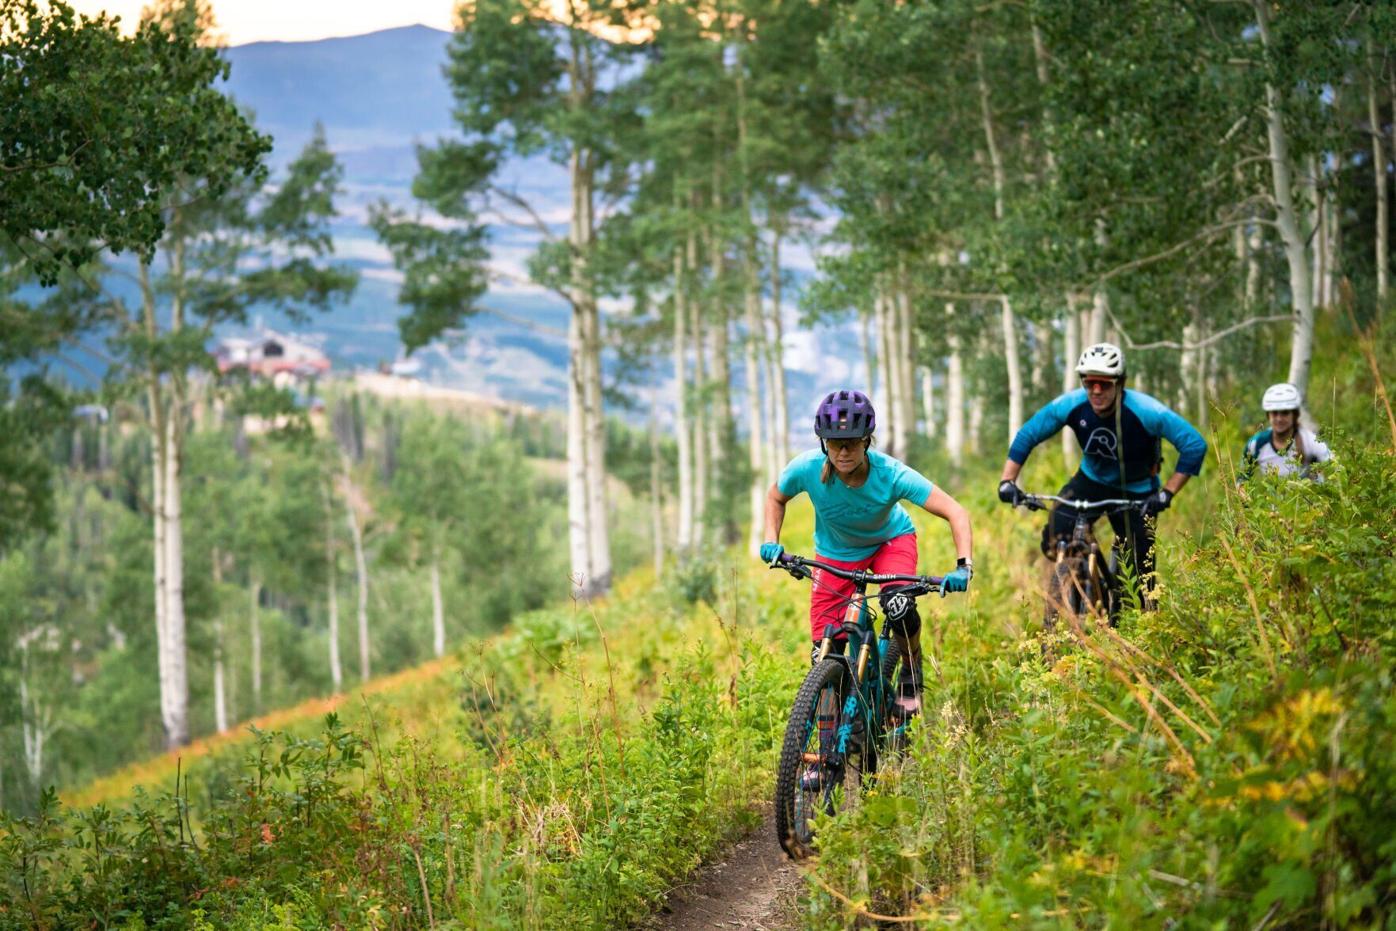
Steamboat Bike Park is expected to fully open this summer for the first time since 2018. Photo courtesy Steamboat Resort


Steamboat Bike Park is expected to fully open this summer for the first time since 2018. Photo courtesy Steamboat Resort
Where does Colorado rank nationally among the best mountain biking experiences in the U.S.?
A recent study from bike rack company VelociRAX (www.velocirax.com) tackled this question by analyzing seven key factors the company felt shape the riding experience.
Here are the factors, along with their respective weights:
- Number of trails per 1,000 square miles – 22.5%
- Percentage of hilly terrain – 22.5%: (Terrain with slopes greater than 3 degrees)
- Miles of trails per 1,000 square miles 15%
- Percentage of difficult trails 15%
- Average trail score (out of 100) – 10%: (Based on rider reviews, this reflects the overall quality and enjoyment of the trails)
- Bikeability rank – 10%
- Average elevation (in feet) – 5%
All 50 states mountain biking experience ranking
| Rank | State | Number of Trails per 1,000 Square Miles | % of Hilly Terrain (Defined as >3° Slope) | Miles of Trails per 1,000 Square Miles | % of Difficult Trails | Average Trail Score (out of 100) | Rideability Rank | Average Elevation (in Feet) | Total Score |
|---|---|---|---|---|---|---|---|---|---|
| 1 | Vermont | 64.89 | 69.02 | 53.24 | 25.8 | 81 | 22 | 1,210.00 | 56.8 |
| 2 | West Virginia | 15.36 | 78.31 | 27.27 | 24.28 | 84 | 33 | 1,657.55 | 50.55 |
| 3 | Idaho | 18.21 | 32.55 | 65.34 | 36.4 | 74 | 36 | 5,231.24 | 48.61 |
| 4 | Massachusetts | 132.37 | 3.87 | 108.39 | 14.39 | 79 | 2 | 534.87 | 45.99 |
| 5 | New Hampshire | 71.18 | 25.85 | 70.96 | 18.02 | 76 | 31 | 1,121.31 | 44.62 |
| 6 | Colorado | 45.35 | 14.97 | 109 | 27.41 | 72 | 6 | 6,860.61 | 43.96 |
| 7 | Connecticut | 88.4 | 11.82 | 94.53 | 17.35 | 79 | 13 | 464.2 | 42.64 |
| 8 | Montana | 6.98 | 36.53 | 20.81 | 38.39 | 68 | 43 | 4,134.57 | 42.53 |
| 9 | Maryland | 93.74 | 3.3 | 126.59 | 13.76 | 77 | 9 | 400 | 41.96 |
| 10 | Pennsylvania | 41.97 | 32.36 | 65.14 | 21.68 | 77 | 19 | 1,233.22 | 40.34 |
| 11 | Hawaii | 6.86 | 39.14 | 26.62 | 29.33 | 80 | 25 | 2,956.55 | 38.36 |
| 12 | Utah | 22.3 | 26.36 | 62.49 | 25.99 | 69 | 14 | 6,011.91 | 37.36 |
| 13 | Wyoming | 7.95 | 21.21 | 14.09 | 25.84 | 74 | 44 | 6,396.12 | 35.22 |
| 14 | Tennessee | 23.44 | 20.37 | 38.77 | 23.71 | 78 | 29 | 938.15 | 33.56 |
| 15 | Virginia | 34.87 | 12.34 | 65.11 | 25.78 | 74 | 12 | 993.25 | 32.85 |
| 16 | New Jersey | 50.56 | 4.39 | 83.8 | 12.7 | 76 | 26 | 227.95 | 32.41 |
| 17 | Alaska | 0.42 | 39.52 | 1.27 | 26.16 | 76 | 34 | 710.56 | 32.1 |
| 18 | Kentucky | 11.63 | 21.26 | 23.36 | 19.57 | 88 | 32 | 815.66 | 31.13 |
| 19 | New Mexico | 11.42 | 13.23 | 28.12 | 24.21 | 66 | 35 | 5,771.76 | 30.18 |
| 20 | Arizona | 14.32 | 8.72 | 36.83 | 23.59 | 68 | 37 | 4,213.12 | 29.9 |
| 21 | Nevada | 4.08 | 14.7 | 13.05 | 23.5 | 74 | 38 | 5,527.71 | 29.66 |
| 22 | Arkansas | 25.65 | 10.5 | 27.04 | 16.94 | 83 | 39 | 524.22 | 29.65 |
| 23 | Oregon | 11.01 | 31.92 | 32.61 | 23.27 | 73 | 3 | 3,520.85 | 29.17 |
| 24 | Missouri | 9.87 | 3.23 | 21.26 | 21.51 | 84 | 49 | 844.72 | 28.75 |
| 25 | California | 31 | 17.96 | 60.47 | 18.84 | 69 | 4 | 2,796.36 | 28.58 |
| 26 | Alabama | 8.03 | 9.24 | 11.27 | 21.85 | 83 | 46 | 451.86 | 27.97 |
| 27 | North Carolina | 22.06 | 8.93 | 40.19 | 18.87 | 77 | 17 | 744.65 | 25.2 |
| 28 | New York | 31.03 | 8.49 | 34.9 | 15.89 | 79 | 15 | 1,045.33 | 24.94 |
| 29 | Washington | 22.86 | 20.06 | 34.87 | 17.98 | 73 | 1 | 2,280.59 | 24.35 |
| 30 | Rhode Island | 33.66 | 0.41 | 25.89 | 19.23 | 81 | 18 | 248.13 | 24.02 |
| 31 | Nebraska | 1.02 | 0 | 4.02 | 19.23 | 78 | 48 | 2,604.78 | 22.82 |
| 32 | South Dakota | 2.89 | 6.76 | 6.95 | 14.8 | 79 | 45 | 2,184.60 | 22.77 |
| 33 | Georgia | 13.14 | 3.36 | 27.93 | 20.36 | 74 | 23 | 498.37 | 21.57 |
| 34 | Ohio | 14.57 | 6.08 | 24.34 | 17.3 | 79 | 16 | 891.44 | 20.9 |
| 35 | Wisconsin | 8.02 | 2.65 | 14.67 | 16.84 | 83 | 27 | 1,006.09 | 20.77 |
| 36 | South Carolina | 12.22 | 1.18 | 24.61 | 7.34 | 78 | 47 | 316.71 | 20.32 |
| 37 | Indiana | 10.02 | 0.53 | 14.39 | 20.55 | 82 | 20 | 738.93 | 20.25 |
| 38 | Maine | 7.63 | 6.84 | 15.66 | 13.33 | 82 | 28 | 757.45 | 20.22 |
| 39 | Mississippi | 3.05 | 0 | 4.56 | 9.09 | 89 | 50 | 282.35 | 20.14 |
| 40 | Oklahoma | 4.45 | 0.96 | 7.23 | 11.8 | 80 | 42 | 1,287.86 | 19.04 |
| 41 | Delaware | 32.32 | 0 | 50.28 | 7.94 | 78 | 7 | 44.57 | 18.38 |
| 42 | Texas | 5.59 | 0.57 | 8.5 | 14.51 | 79 | 30 | 1,649.20 | 18.06 |
| 43 | Iowa | 6.68 | 0.48 | 7.14 | 15.16 | 84 | 24 | 1,062.98 | 17.94 |
| 44 | Michigan | 13.92 | 0.11 | 39.27 | 12.01 | 80 | 10 | 771.49 | 17.43 |
| 45 | Minnesota | 8.92 | 1.72 | 16.28 | 19.58 | 76 | 5 | 1,198.06 | 15.97 |
| 46 | Florida | 13.49 | 0 | 20 | 12.63 | 76 | 8 | 58.26 | 13.36 |
| 47 | North Dakota | 1.17 | 0 | 2.68 | 7.41 | 69 | 41 | 1,827.50 | 13.14 |
| 48 | Kansas | 4.84 | 0.13 | 9.1 | 6.53 | 80 | 21 | 1,906.83 | 12.9 |
| 49 | Louisiana | 1.4 | 0 | 4.91 | 4.92 | 74 | 40 | 93.5 | 12.1 |
| 50 | Illinois | 9.81 | 0.03 | 18.35 | 7.04 | 79 | 11 | 618.71 | 11.82 |
As for Colorado, well, the Centennial State ranked sixth, according to the study.
Colorado was found to be famous for its high mountains and outdoor sports. It has fewer trails per area but offers over 109 miles of trails per 1,000 square miles. Its terrain is less hilly than some others at 15%, but it has a good percentage of difficult trails at 27%. Colorado’s high average elevation of nearly 6,900 feet adds to its appeal for riders seeking altitude and challenge.
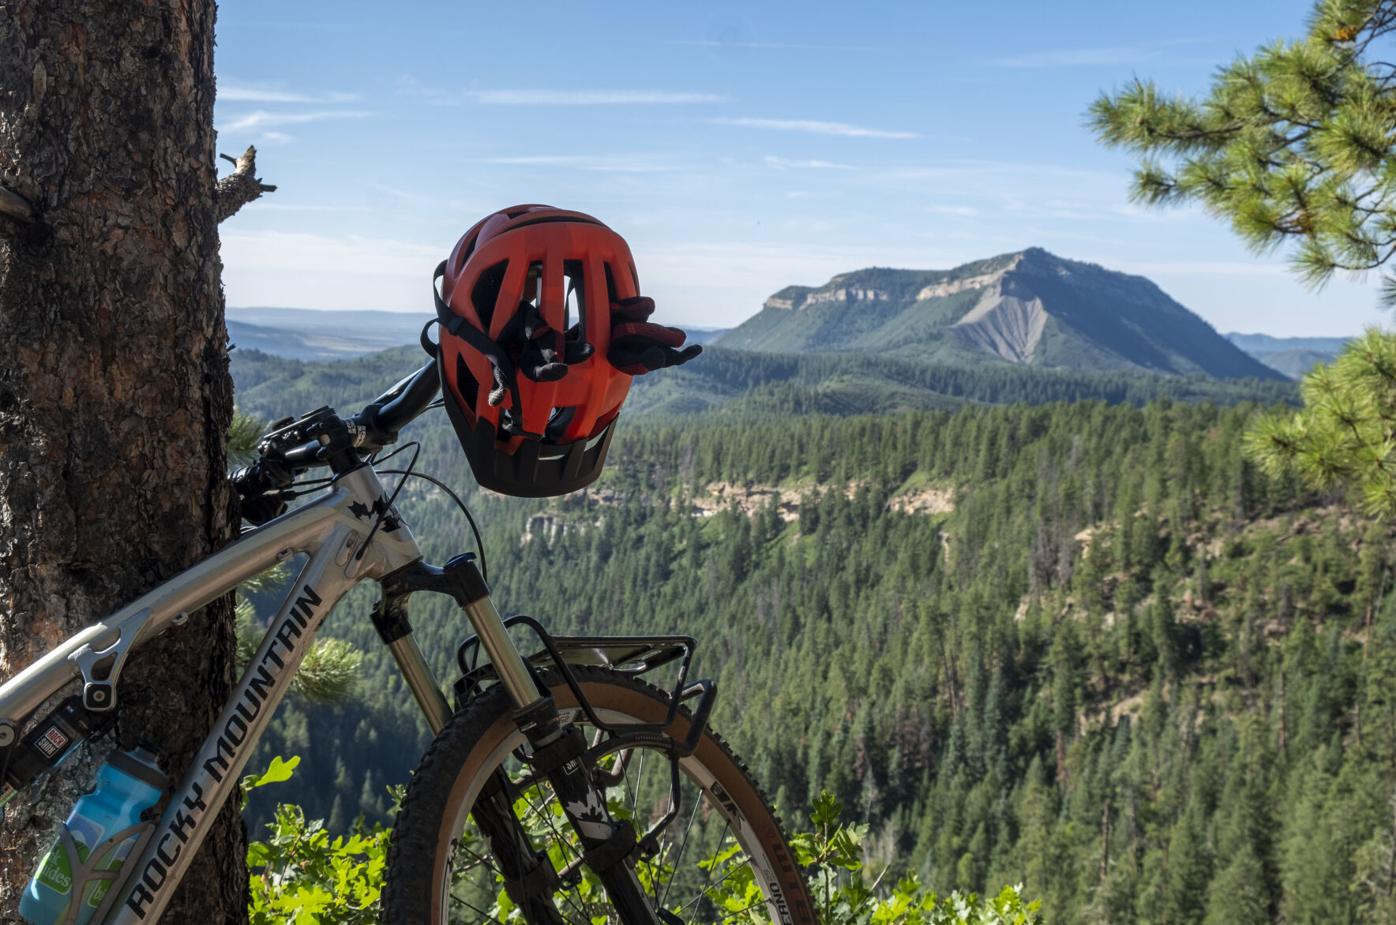
Denver Gazette Digital Producer Jonathan Ingraham's helmet dangles from his mountain bike with the northern massif of Perins Peak visible in the background Tuesday, July 30, 2024 northwest of Durango, Colorado while at Gudy's Rest on Segment 28 of the Colorado Trail.
Jonathan Ingraham jonathan.ingraham@denvergazette.com

Denver Gazette Digital Producer Jonathan Ingraham’s helmet dangles from his mountain bike with the northern massif of Perins Peak visible in the background Tuesday, July 30, 2024 northwest of Durango, Colorado while at Gudy’s Rest on Segment 28 of the Colorado Trail.
Only two other western states made the top 10.
Idaho ranked third, standing out with its high average elevation of over 5,200 feet. It has fewer trails per square mile but offers the highest percentage of difficult trails at 36.4%. With 65.34 miles of trails per 1,000 square miles and a solid average trail score, Idaho appeals to more experienced mountain bikers.
Montana ranked eighth, with fewer trails at about 7 per 1,000 square miles but a decent 36.5% hilly terrain. It offers fewer miles of trails per area but has the highest percentage of difficult trails along with Idaho, at 38.4%. Its high elevation of over 4,100 feet adds to its rugged mountain biking options.
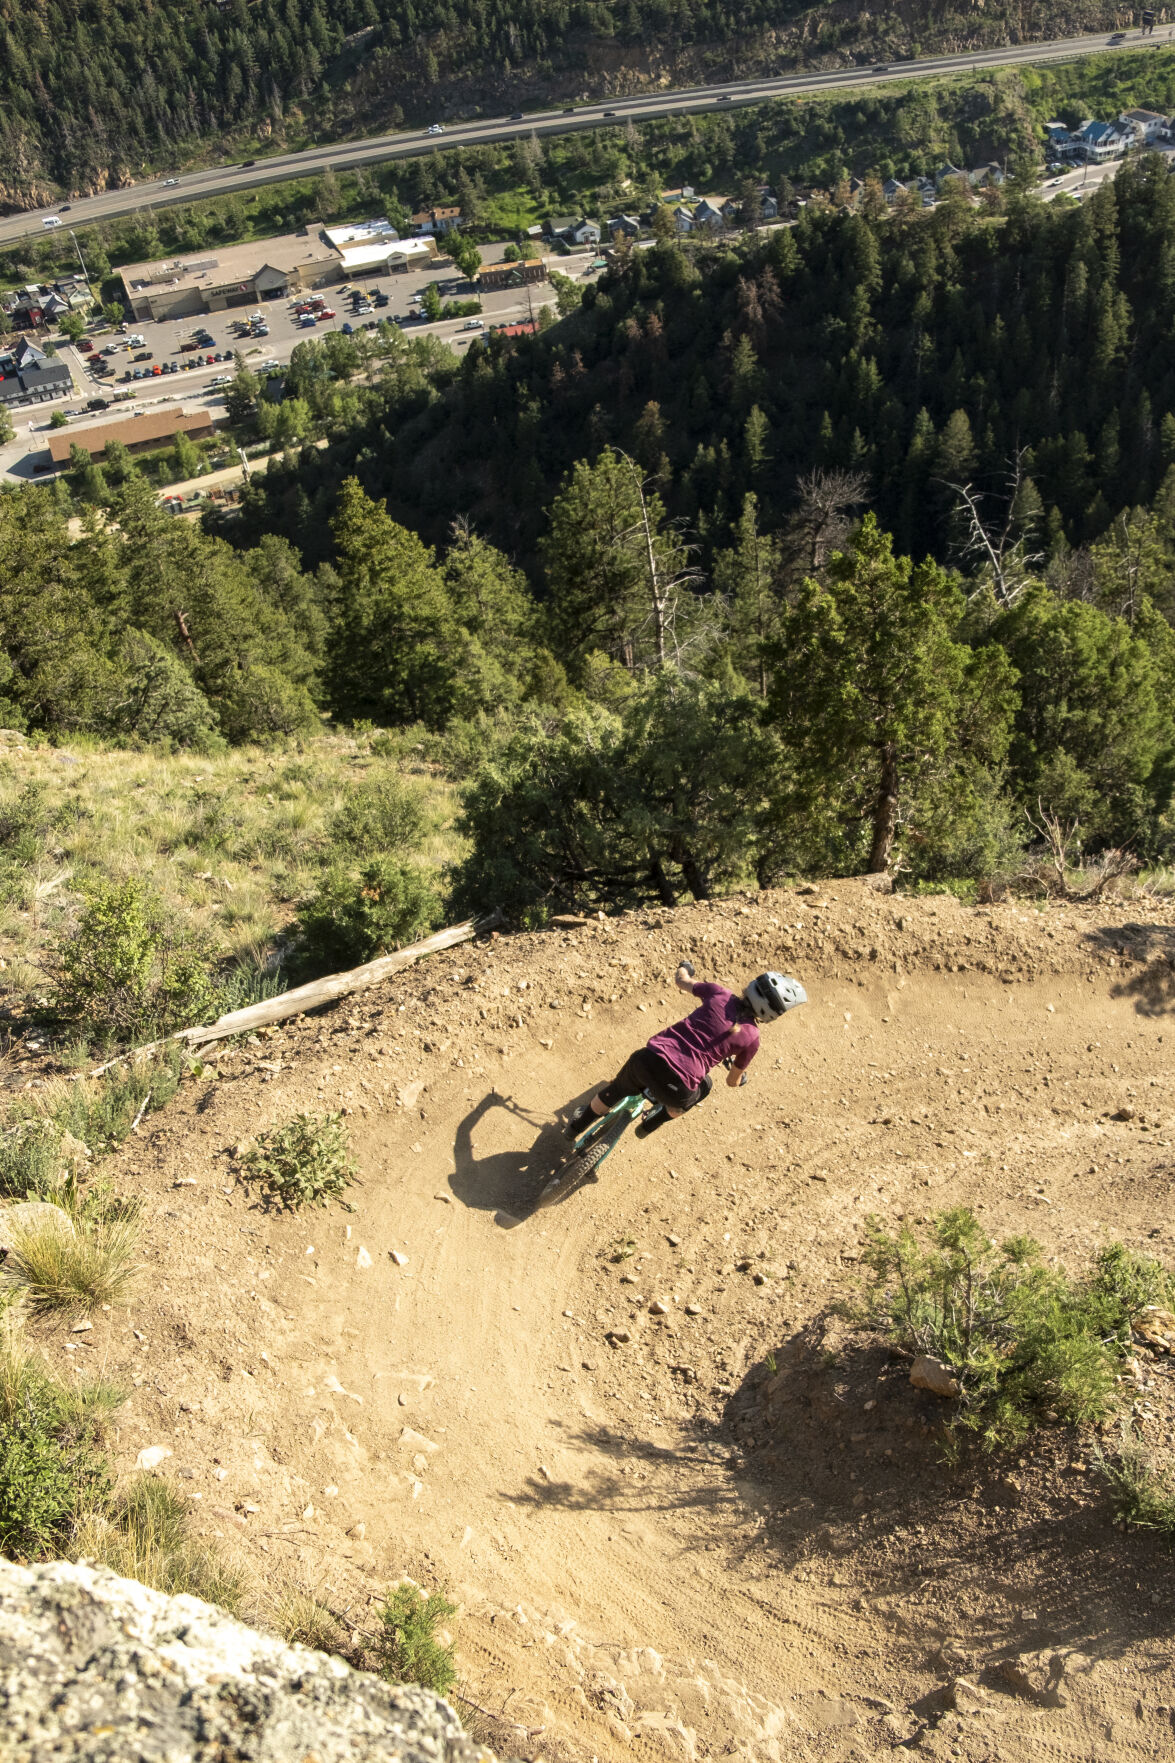
A female mountain bike racer banks on a berm on Drop Shaft trail during race three of the Session Series Wednesday, June 18, 2025 at Trek Trails at Virginia Canyon Mountain Park in Idaho Springs, Colorado. Part of Idaho Springs, including I-70, is seen in the distance.
Jonathan Ingraham jonathan.ingraham@denvergazette.com

A female mountain bike racer banks on a berm on Drop Shaft trail during race three of the Session Series Wednesday, June 18, 2025 at Trek Trails at Virginia Canyon Mountain Park in Idaho Springs, Colorado. Part of Idaho Springs, including I-70, is seen in the distance.
The No. 1 spot went to small, but mighty Vermont, according to the study.
Vermont topped the list for mountain biking with a solid balance of factors. It has 64.89 trails per 1,000 square miles and nearly 70% hilly terrain. The state offers 53.24 miles of trails per 1,000 square miles, with over a quarter marked as difficult. Vermont’s trails score well on average, and its moderate elevation of 1,210 feet adds to a varied riding experience.
Methodology use:
The study ranked U.S. states for mountain biking by evaluating seven key factors influencing the quality and challenge of the riding experience. Each factor was assigned a specific weight based on its importance to mountain bikers, and data was collected for all 50 states.
The factors were scored on a scale from 0 to 100, with higher scores representing better mountain biking conditions.
Sources came from:
- MTB Project
- USDA Economic Research Service
- Trailforks
- League of American Bicyclists
(Contact Denver Gazette Digital Strategist Jonathan Ingraham at jonathan.ingraham@denvergazette.com or on X at @Skingraham.)
Mighty Argo Cable Car receives 10 gondola towers from a Blackhawk helicopter
Jonathan Ingraham
jonathan-ingraham@midtc.com
Updated 4 weeks ago
Facebook Twitter WhatsApp SMS Email Print Copy article link Save Bryan MacFarland, general partner to the Mighty Argo Cable Car scenic gondola project, holds up an artist’s rendering of what the MACC will look like when completed from atop the...
Jonathan Ingraham
Reporter
Popular Colorado mountain recreation area to see realignment on trails
Jonathan Ingraham
jonathan-ingraham@midtc.com
Updated 4 weeks ago
1 of 1Brainard Lake and Indian Peaks near Nederland. File photo. Photo Credit: Faina Gurevich (iStock).Faina Gurevich Facebook Twitter WhatsApp SMS Email Print Copy article link Save Starting in early July, visitors to the very popular Brainard Lake Recreation Area west...
Jonathan Ingraham
Reporter
Popular trail in Colorado’s mountains to celebrate groundbreaking ceremony in early July
Jonathan Ingraham
jonathan-ingraham@midtc.com
Updated 1 month ago
Facebook Twitter WhatsApp SMS Email Print Copy article link Save Two females walk along a section of the Eagle Valley Trail in Eagle County near Eagle, Colorado. Courtesy photo, Eagle County Recreationalists not only in Eagle County, but throughout Colorado,...
Jonathan Ingraham
Reporter
Virginia Canyon Mountain Park in Idaho Springs open for hiking and mountain biking
Jonathan Ingraham
jonathan-ingraham@midtc.com
Updated 4 weeks ago
Facebook Twitter WhatsApp SMS Email Print Copy article link Save Aven Gottschling, 16, crests a bridge feature on Drop Shaft trail during race three of the 2025 Session Series Wednesday, June 18, 2025 at Trek Trails at Virginia Canyon Mountain...
Jonathan Ingraham
Reporter
‘Bay to Bay’ Trail at Horsetooth Reservoir in Fort Collins now open
Jonathan Ingraham
jonathan-ingraham@midtc.com
Updated 4 weeks ago
1 of 1Trail workers from Larimer County Conservation Corps work on portions of the Bay to Bay trail in July, 2024 in Fort Collins, Colorado.Courtesy, Larimer County Department of Natural Resources/Jeanie Sumrall-Ajero Facebook Twitter WhatsApp SMS Email Print Copy article...
Jonathan Ingraham
Reporter
Vail professional slackliner talks sport, GoPro Mountain Games ahead of June event
Jonathan Ingraham
jonathan-ingraham@midtc.com
Updated 4 weeks ago
1 of 1Davis Hermes works his way across a highline southwest of Edwards, Colorado. on Thursday, May 1, 2025.Tom Hellauer tom.hellauer@denvergazette.com Facebook Twitter WhatsApp SMS Email Print Copy article link Save Professional slackliner Davis Hermes kicks his foot out during a session...
Jonathan Ingraham
Reporter
What gear I’m bringing for a bikepacking trip on the Colorado Trail
Jonathan Ingraham
jonathan-ingraham@midtc.com
Updated 4 weeks ago
1 of 1Jonathan Ingraham stands with his bike at the Waterton Canyon trailhead in Littleton, Colo. on Wednesday, June 26, 2024.Tom Hellauer tom.hellauer@denvergazette.com Facebook Twitter WhatsApp SMS Email Print Copy article link Save An adventure like “bikepacking” the Colorado Trail...
Jonathan Ingraham
Reporter
Berthoud Bike Park gears up for Pedalpalooza 2024 | Trail Trax
Jonathan Ingraham
jonathan-ingraham@midtc.com
Updated 4 weeks ago
Facebook Twitter WhatsApp SMS Email Print Copy article link Save In what should be a more deserving grand opening in 2024 than the hampering and continuous rain-soaking delays of 2023, the Berthoud Bike Park in northern Colorado is gearing up...
Jonathan Ingraham
Reporter
2 new trails in Boulder’s Open Space Department near completion | Trail Trax
Jonathan Ingraham
jonathan-ingraham@midtc.com
Updated 4 weeks ago
Facebook Twitter WhatsApp SMS Email Print Copy article link Save The highly anticipated North Sky Trail in Boulder County has a new bridge nearing completion as construction of the trail pushes forward, Boulder’s Open Space and Mountain Parks Department (OSMP)...
Jonathan Ingraham
Reporter
Popular Colorado mountain bike races Breck Epic, Session Series highlight 2024 | Trail Trax
Jonathan Ingraham
jonathan-ingraham@midtc.com
Updated 4 weeks ago
Facebook Twitter WhatsApp SMS Email Print Copy article link Save Nestled at the center of one of the world’s best sprawling and interconnected backcountry-trail networks sits Breckenridge, Colorado. You can thank Victorian-era gold and silver miners for creating the foundational...
Jonathan Ingraham
Reporter